Jose L. Hernandez hernandezfj@ornl.gov
David Erickson IIIericksondj@ornl.gov
ABSTRACT
Different kinds of geophysical data sets are used by the Climate dynamics
group at CSM to carry out research and diagnosis in modeling studies. These
data sets come from different observations (satellite, buoys, ships,
etc) or model outputs (GCM and transport models) with different spatial
and time resolutions. This table gives a summary of these data sets and sample plots showing
some current research. The links under variables column display samples plots for each data set.
| Source of Data | Variables | Time covered & period |
Grid (degrees) Dlong*Dlat | Kind of Platform |
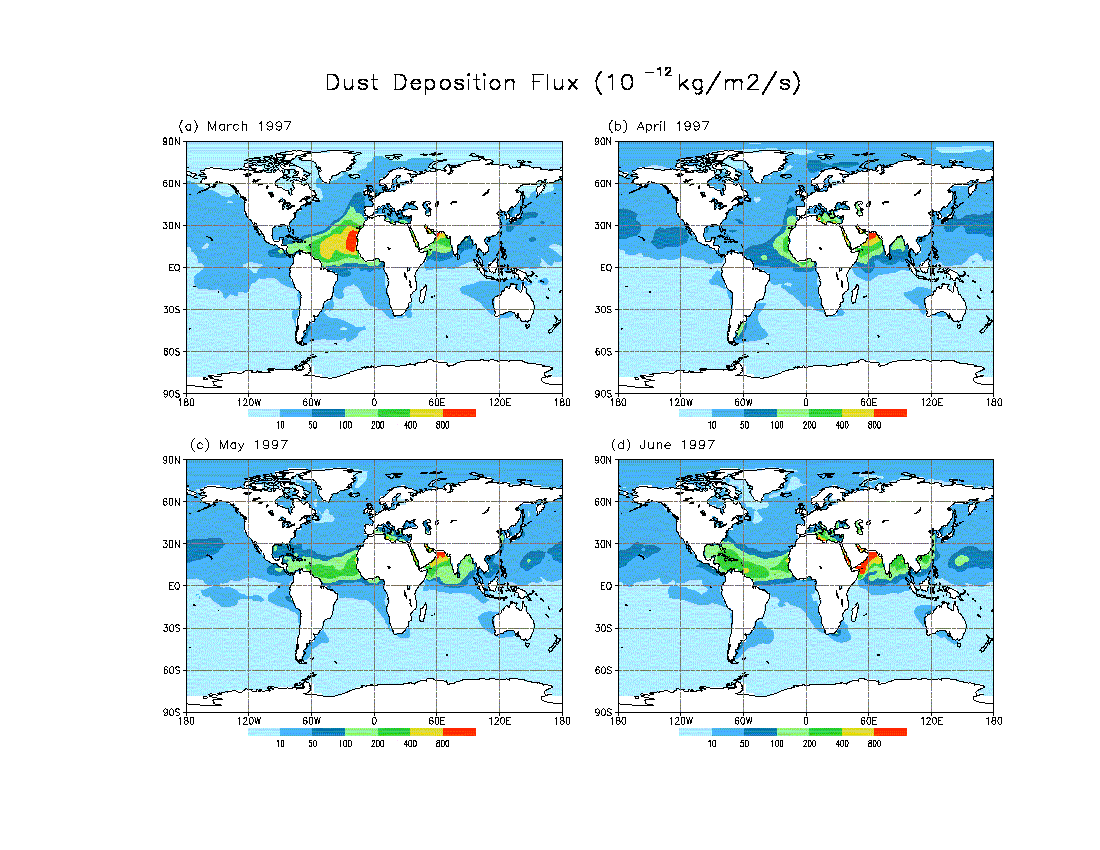
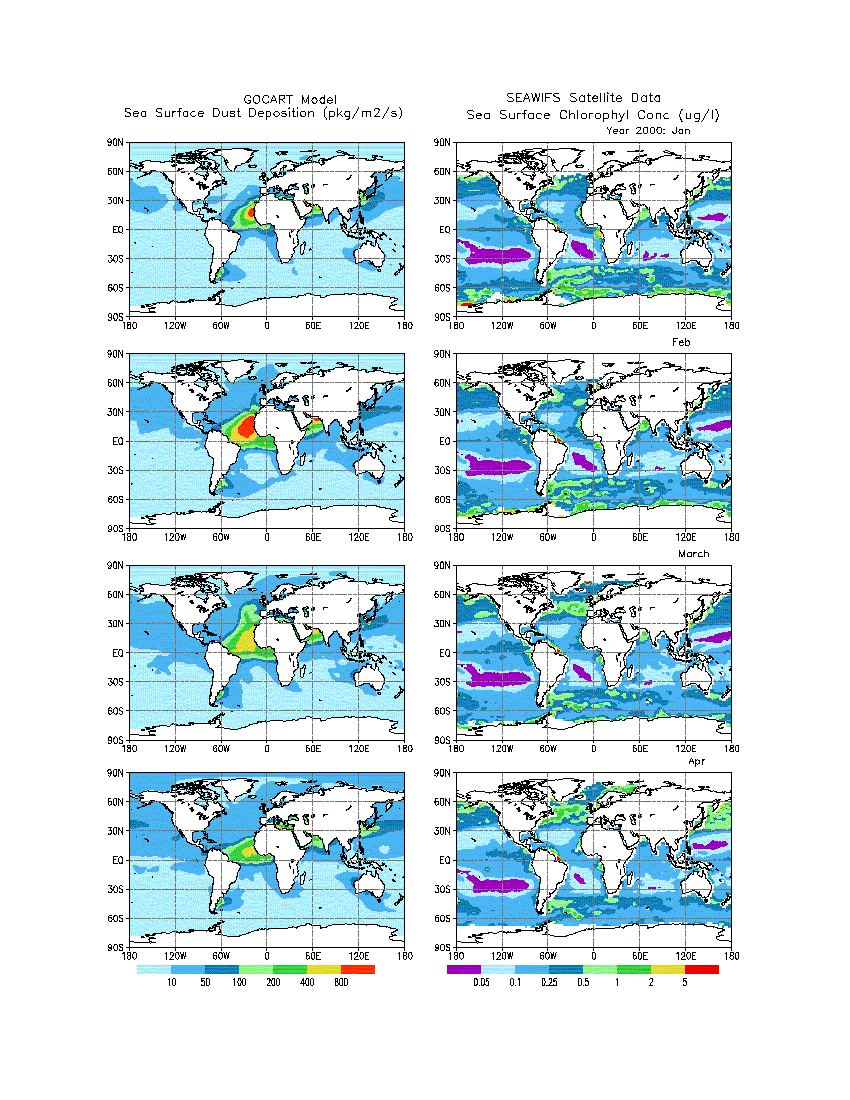
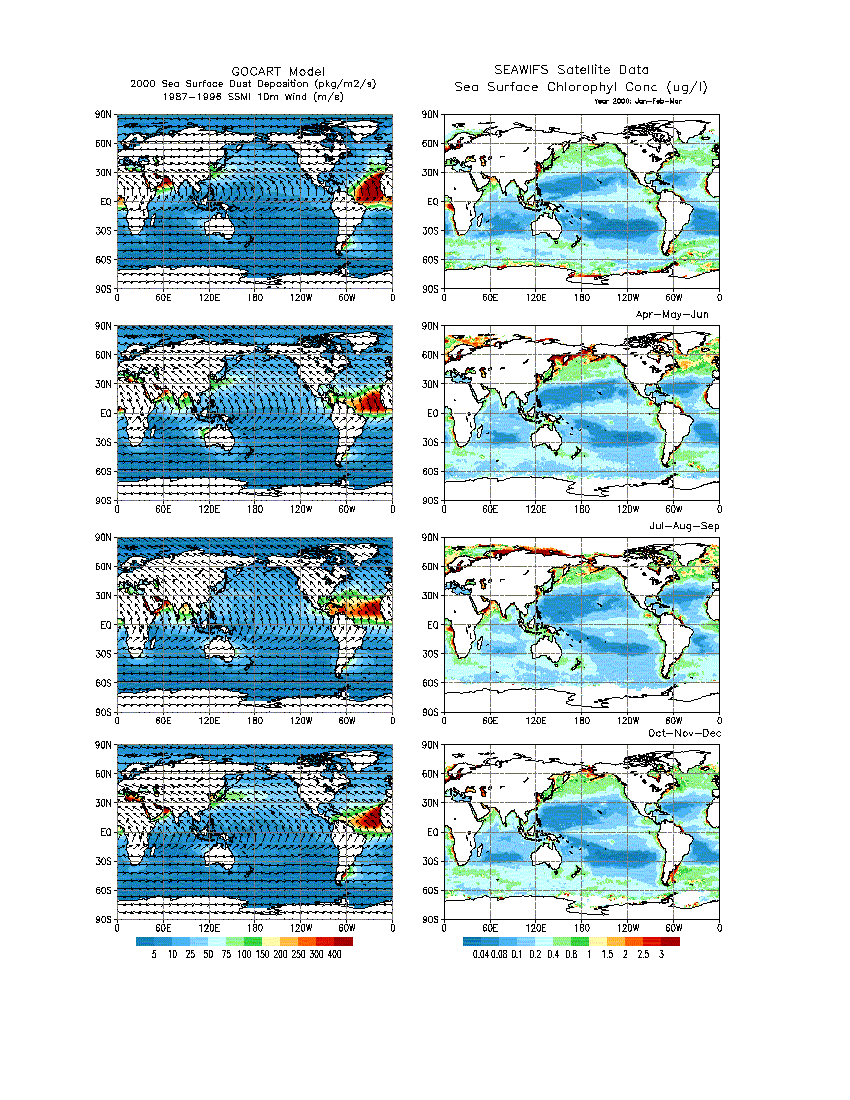
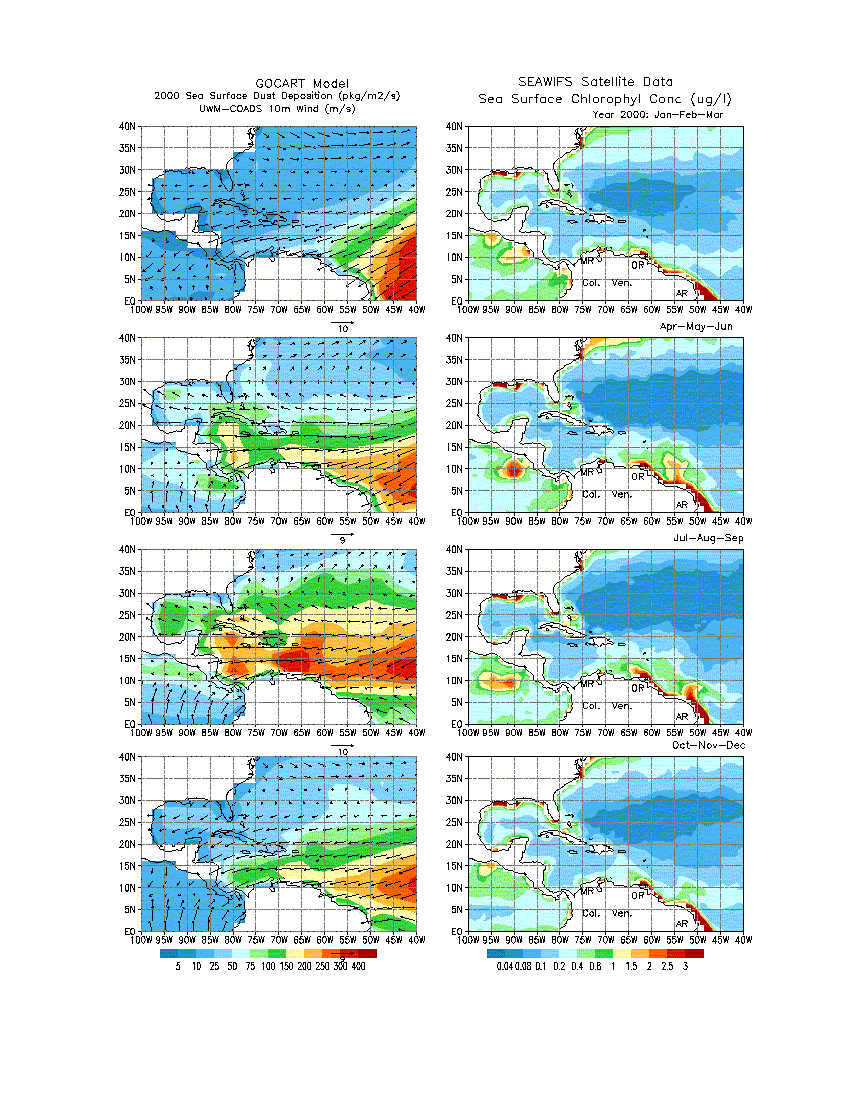
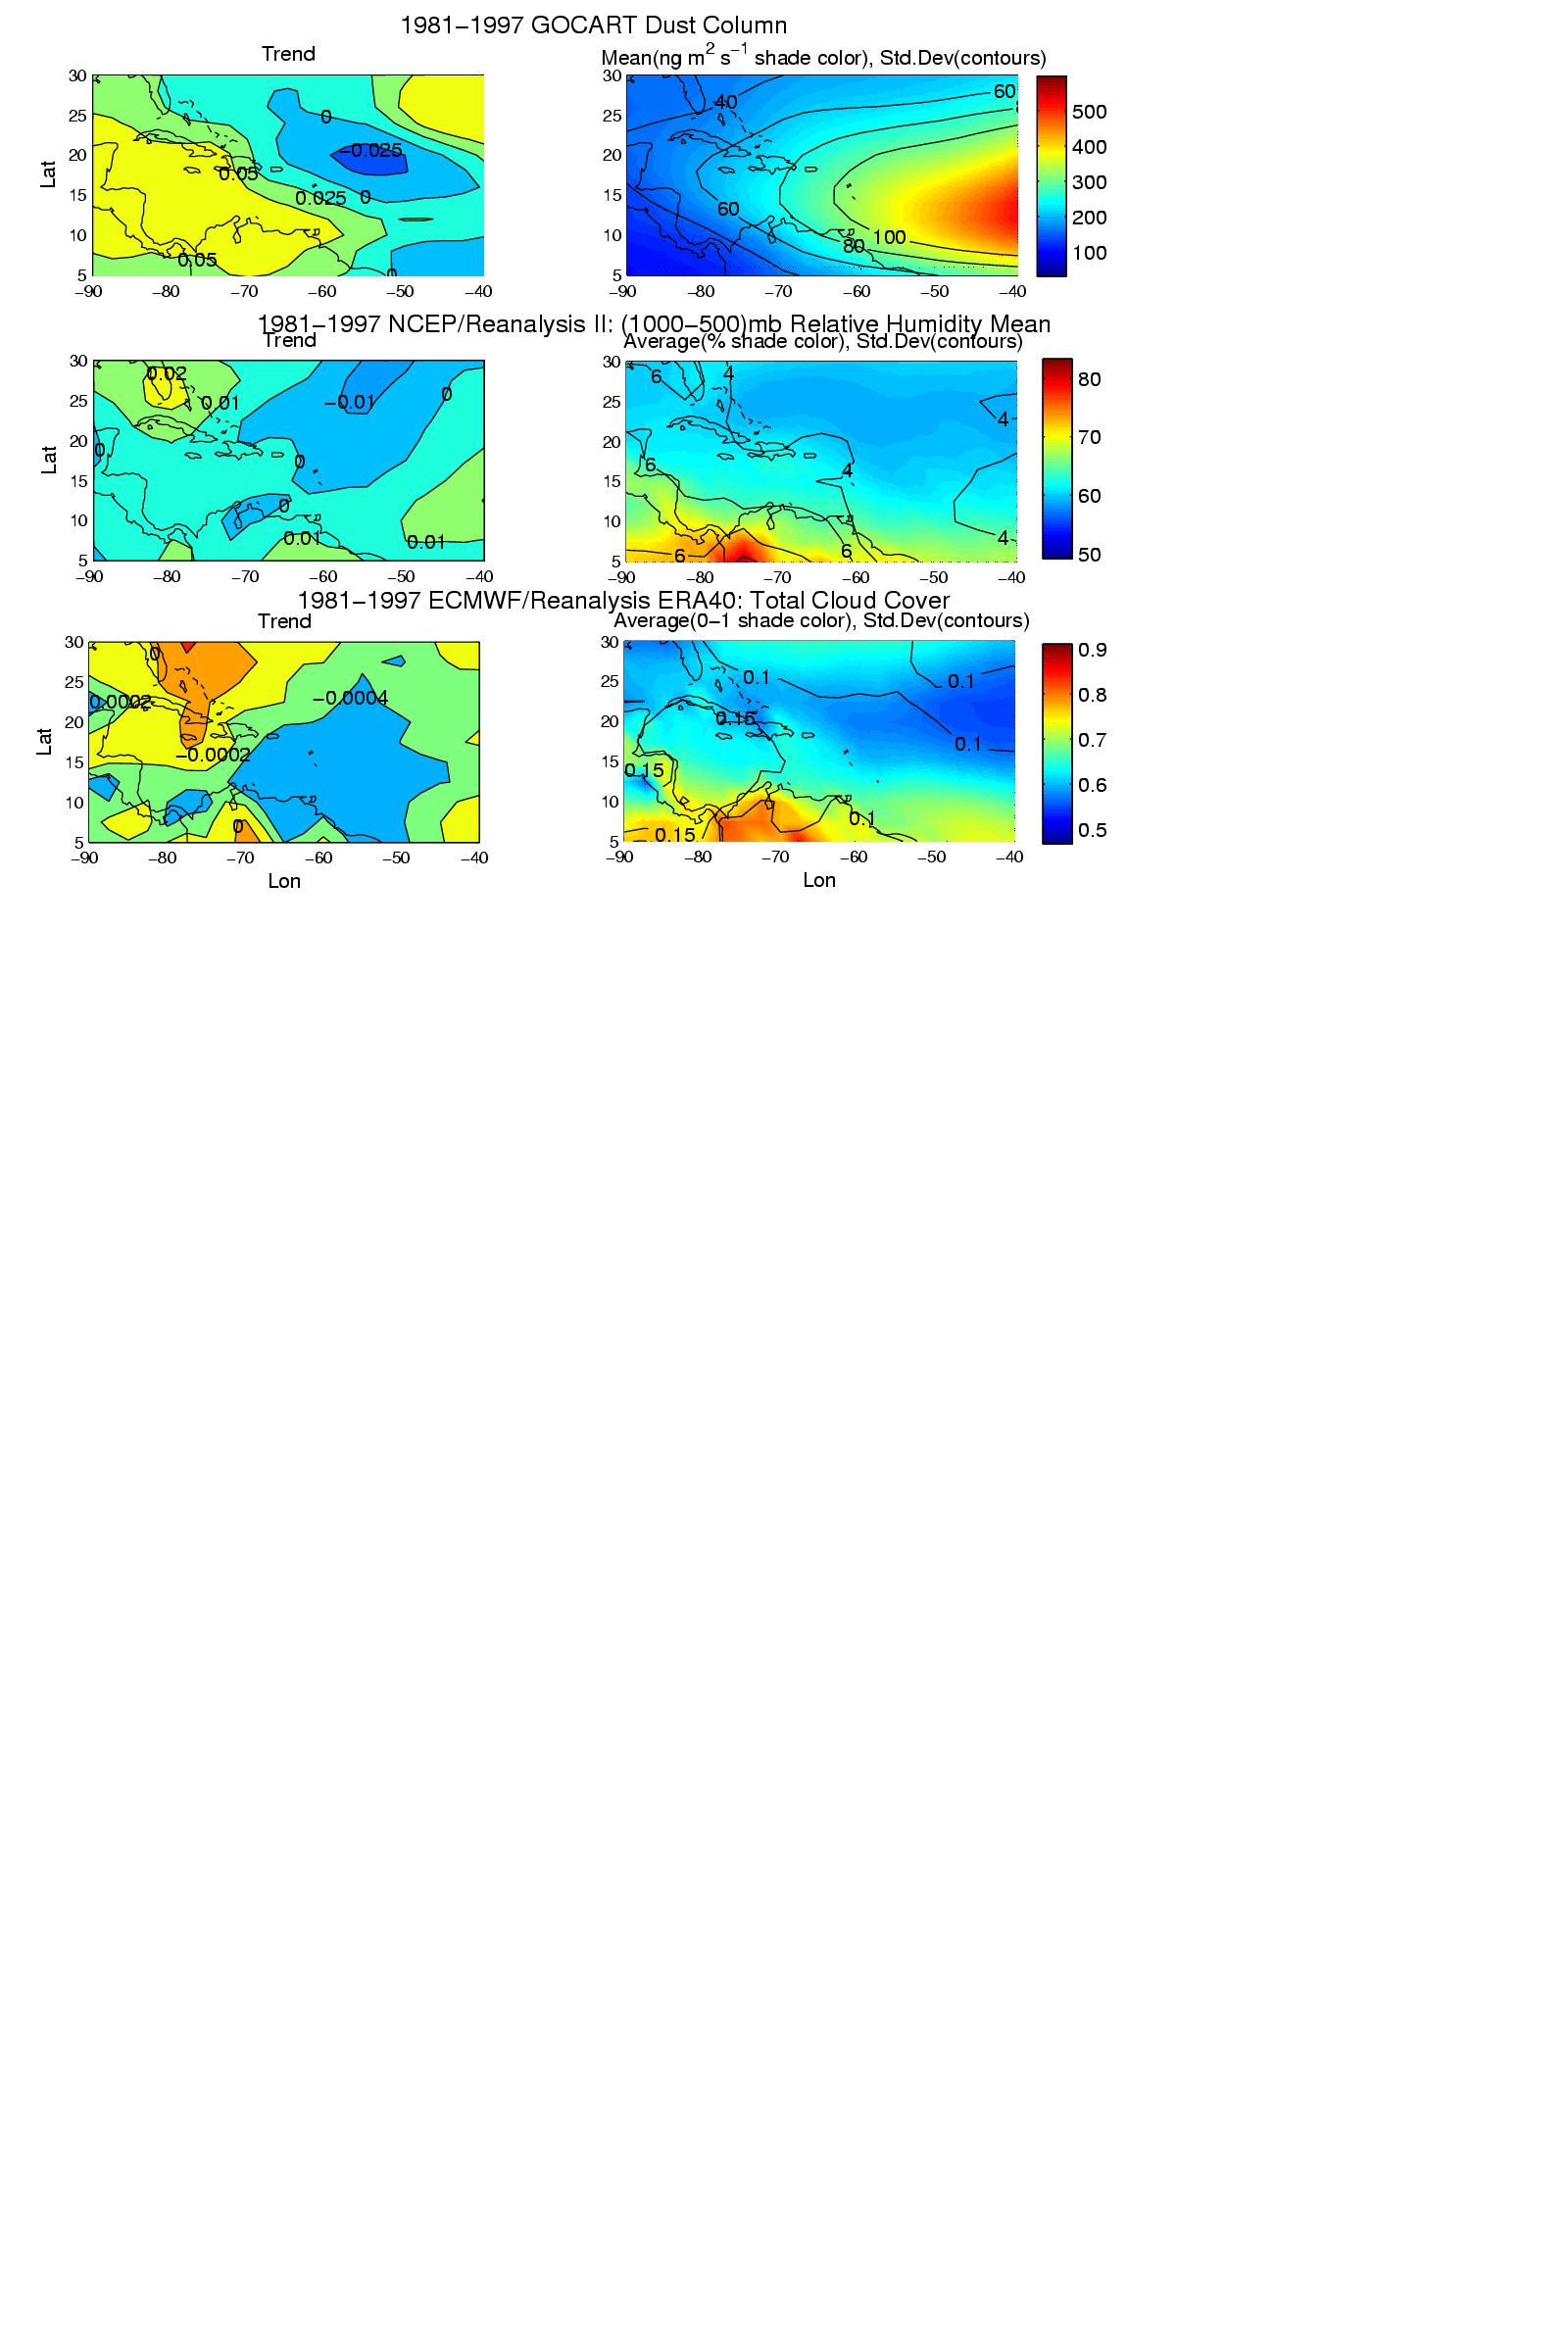
| GOCART | Dust deposition at the ocean surface. Dust 03-05/1997 | - 5 years monthly climatology - Year 2000 monthly average - Nov/96 to June/97 daily, weekly and monthly averages. - 17 years monthly averages Jan/81 to Nov/97 | 2.5x2 (144x91 grid points) | Modeling experiments |
|
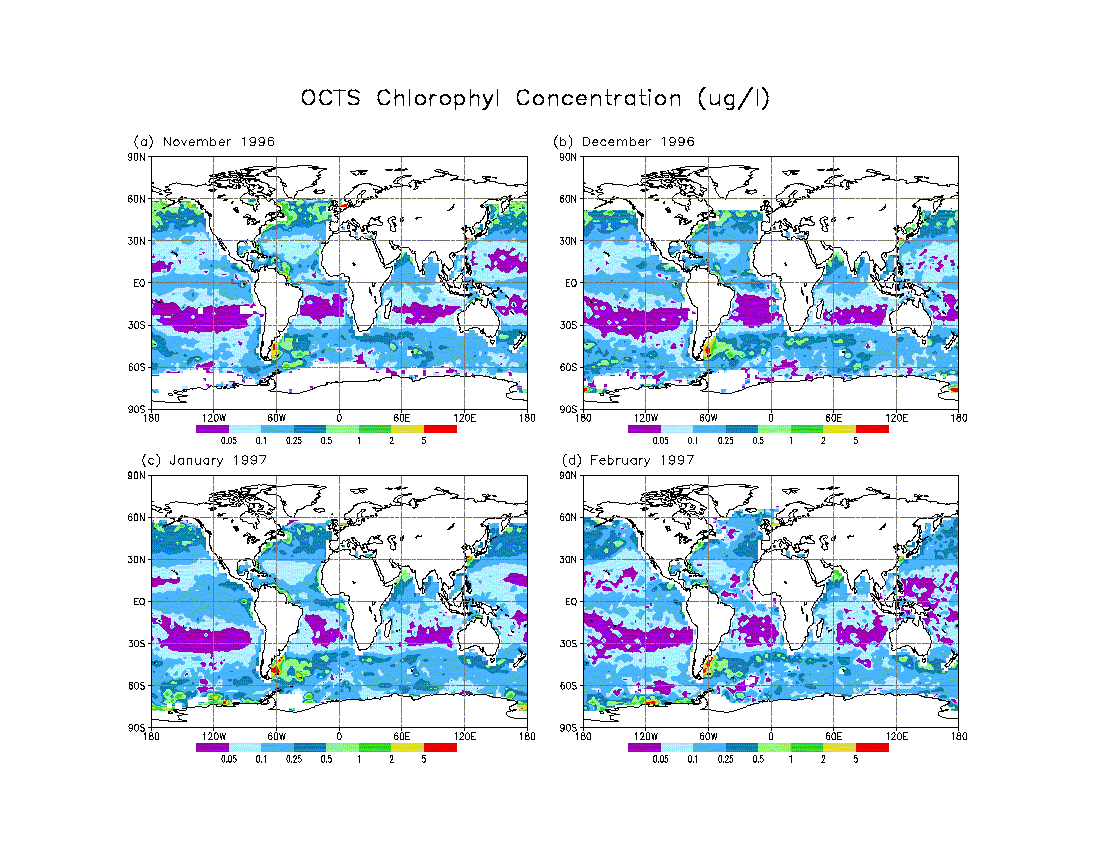
OCTS | Sea surface Chlorophyl-a concentration OCTS Chlo-a | - Nov/96 to June/97 monthly and weekly averages | 1x1 (360x180 grid points) 2.5x2 (144x91 grid points) |
Satellite |
|
SeaWIFS | Sea surface Chlorophyl-a concentration SeaWIFS Chlo-a and Dust | - Year 2000: monthly
average - Year 1998: monthly average - Year 1999: 8 months | 2.5x2 (144x91 grid points) | Satellite |
|
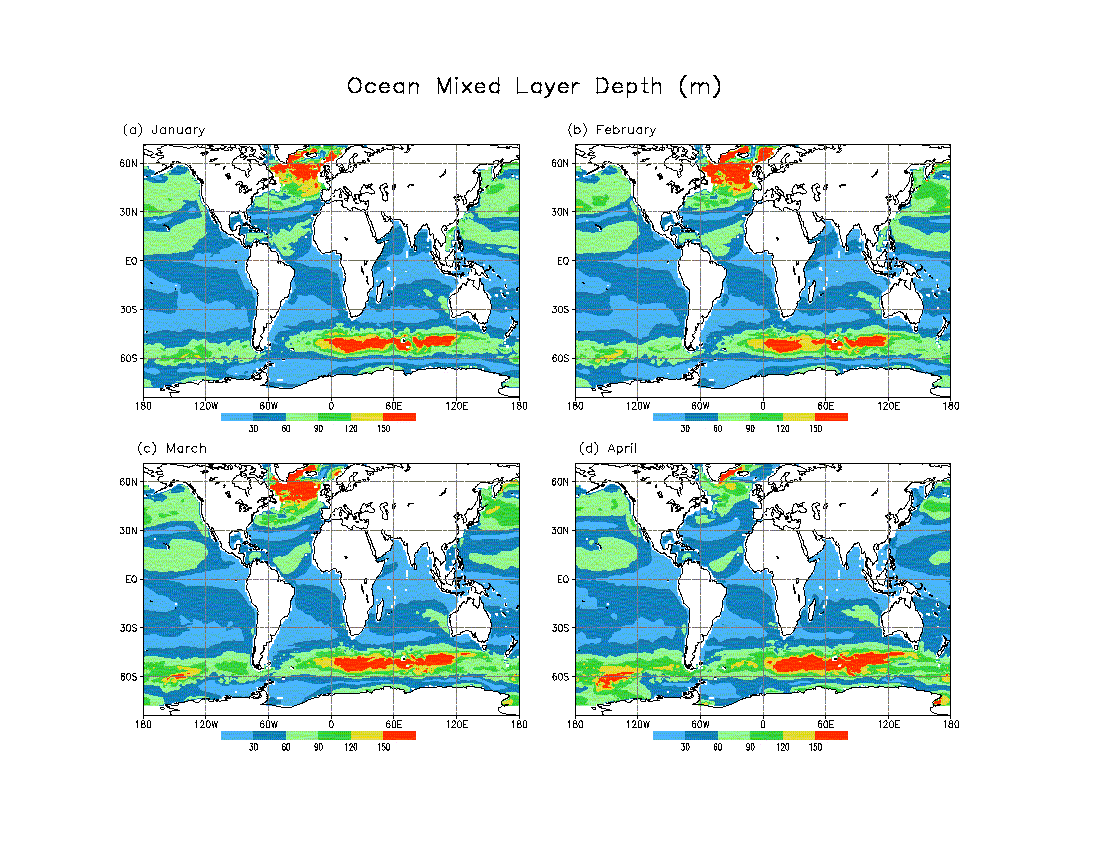
Isopycnal Ocean Model | Ocean Mixed Layer OML Jan-Apr | - Year 1999: monthly average | 1.25x.6667 (288x234 grid points) | Modeling experiment |
|
SSMI-DMSP | 10m level wind speed Wind to explain surface patterns | - Jan/88 to Dec/96
average every 6 hours - Jan/97 to Dec/99 average every 6 hours | 2.5x2 (144x91 grid points) 1x1 (360x180 grid points) | Satellite & Similarity Theory |
|
UWM-COADS: Atlas of Surface Marine Atmosphere | - Climate Parameters: 9 objectively analyzed observations and derived variables | - Jan/90 to Dec/93: Monthly climatology and 4-years monthly anomalies | 1x1 (360x180 grid points) | Objective analysis and
observations(ships, buoys, bathytermographs) |
|
COADS: Comprehensive Ocean Atmosphere Data Set |
- 22 observed and computed variables - Summary Statistics 1980-1997 COADS Climatology | - 1800 to 1997 monthly statistics (2x2deg) - 1960-1997 (1x1deg) | - Data not interpolated - Statistics where data exists | Observation from different platform and statistical analysis
|
|
ECMWF 40-years reanalysis |
- Many climate parameters
(see web site) Surface and pressure levels ERA40 & COADS Cloud cover | - 1957 to 2002: 6-hours mean - 2.5degx2.5deg - 1000mb to 1mb pressure levels | - 144(lon),73(lat), 23(lev): | - Data assimilation: Direct and Satellite Observations - forecast model |
|
NCEP/Reanalysis II 1948 to present |
- Many climate parameters
(see web site) Several kind of levels (surface,pressure,sigma) 1981-1997 Statistic Summary Dust, Rel. Hum and Clouds | - 1948 to present: 6-hours mean and monthly - 2.5degx2.5deg - 17 Pres. levels: 1000hPa to 10hPa | - 144(lon),73(lat), 17(lev): | - Data assimilation: Direct and Satellite Observations - forecast model |
|
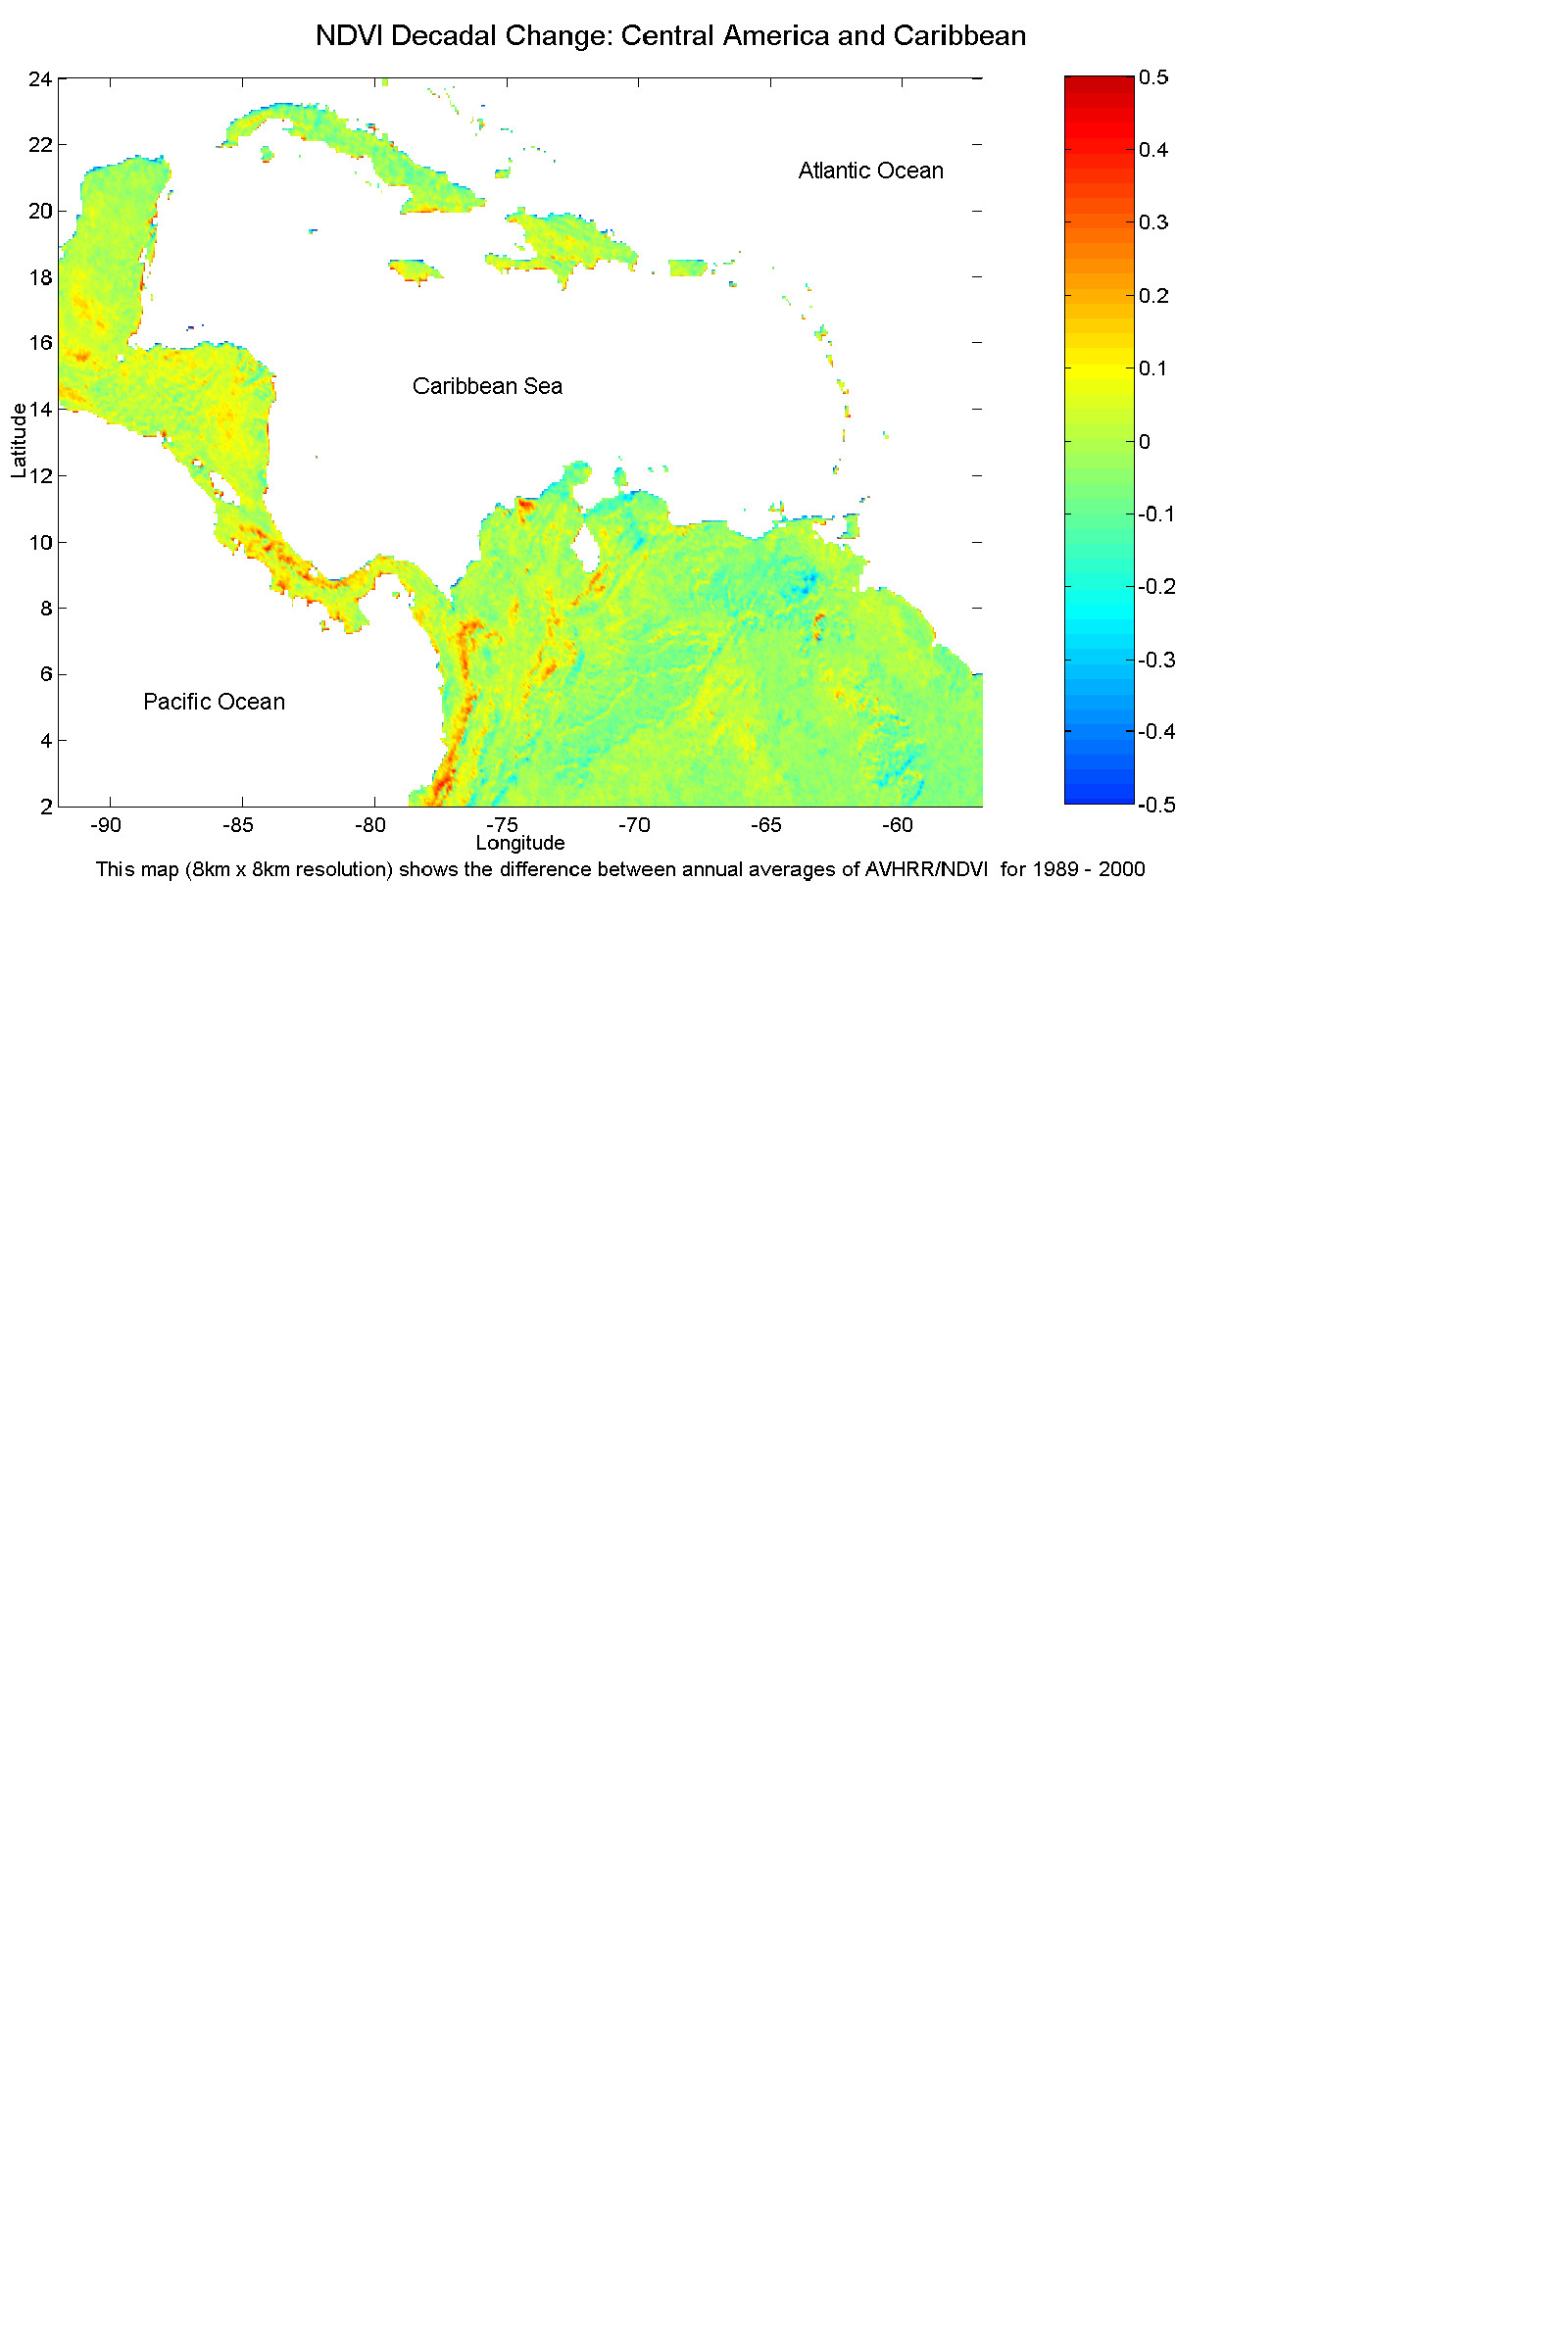
NOAA Satellites - NASA Pathfinder AVHRR Land Program: 1981 to 2001 |
Several surface variables from AVHRR sensor. The normalized difference vegetation index (ndvi) is derived from visible and near-infrared channels. Annual Difference of NDVI: 1981-2000 | Global monthly data: - 8km x 8km and 1 deg x 1 deg resolutions - Two periods: 1981 to 1984 and 1989 to 2001 | - 5004(lon),2168(lat): | - Satellite observations from Advanced Very High Resolution Radiometers on board NOAA satellites: 7, 9, 11, 12, 13 and 14 |